Gold - Market Analysis: Key Levels After the Recent Rejection, March 9-15, 2026
Price Rejection from the Order Block Zone
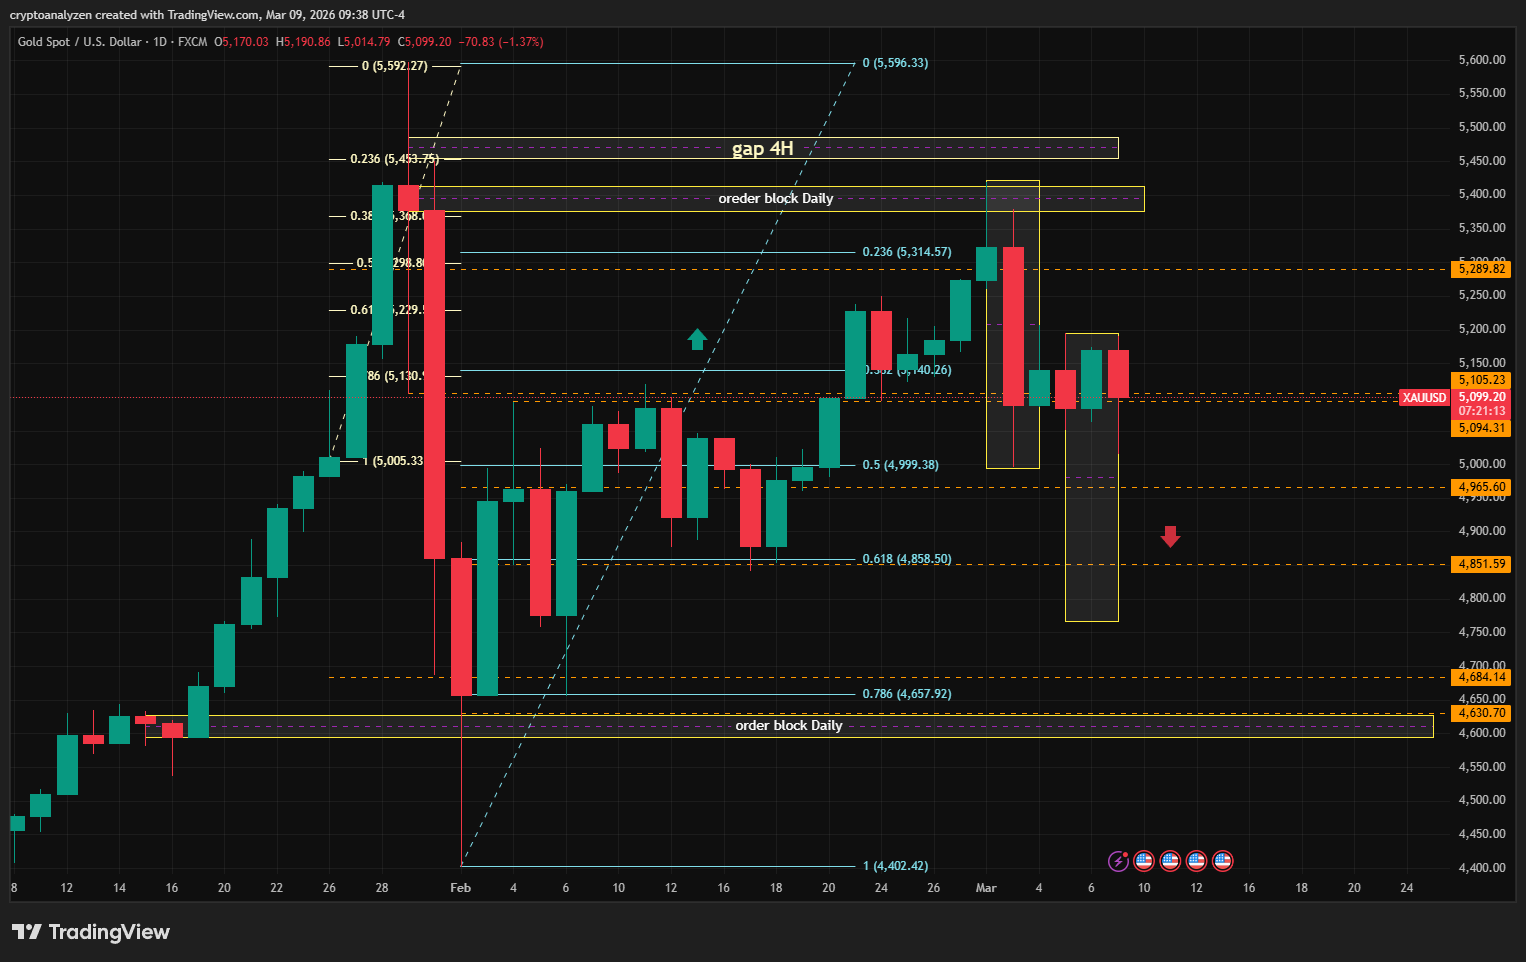
At the beginning of last week, the price reached and moved above the order block zone (5.377–5.414) marked on the chart.
However, the move above this level was short-lived.
The market quickly reversed and declined to 4.999, which corresponds to the 50% retracement of the entire range between the all-time high at 5.596 and the mid-low at 4.402.
Such a sharp rejection from a supply area often signals strong selling pressure and the possibility that the market may continue moving lower.
Failed Attempts to Move Higher
Throughout the week, the market attempted several recoveries. Despite these efforts, price action remained weak.
The price failed to break above 5.208, which represents the 50% retracement of the first-leg range (5.419–4.995).
The upward movement stalled slightly below this level at 5.195, reinforcing the idea that buyers currently lack sufficient momentum.
This inability to reclaim key retracement levels may indicate preparation for a continuation of the downward move.
Downside Projection
Projecting the first-leg range downward from the bearish pullback level suggests a potential target near 4.768.
An additional technical confluence appears around 4.858, which represents approximately 68% of the entire range.
This level is also closely aligned with the February opening price at 4.888, making it a notable area where the market may react.
Key Levels to Watch if the Decline Continues
If bearish pressure persists, the following levels should be monitored:
4.657
- 78% retracement of the entire range
4.630 – 4.536
- Major order block / accumulation zone
- Formed during January 13–16, 2026
This area may act as a potential demand zone where the market could attempt stabilization or a short-term rebound.
Subscribe to newsletter