Gold Next Move: Breakdown Before Breakout?
Gold’s current structure reflects a complex multi-phase market environment, where short-term bullish movements coexist with mid-term bearish expectations before a potential macro continuation.
1. Quarterly (3-Month) Structure
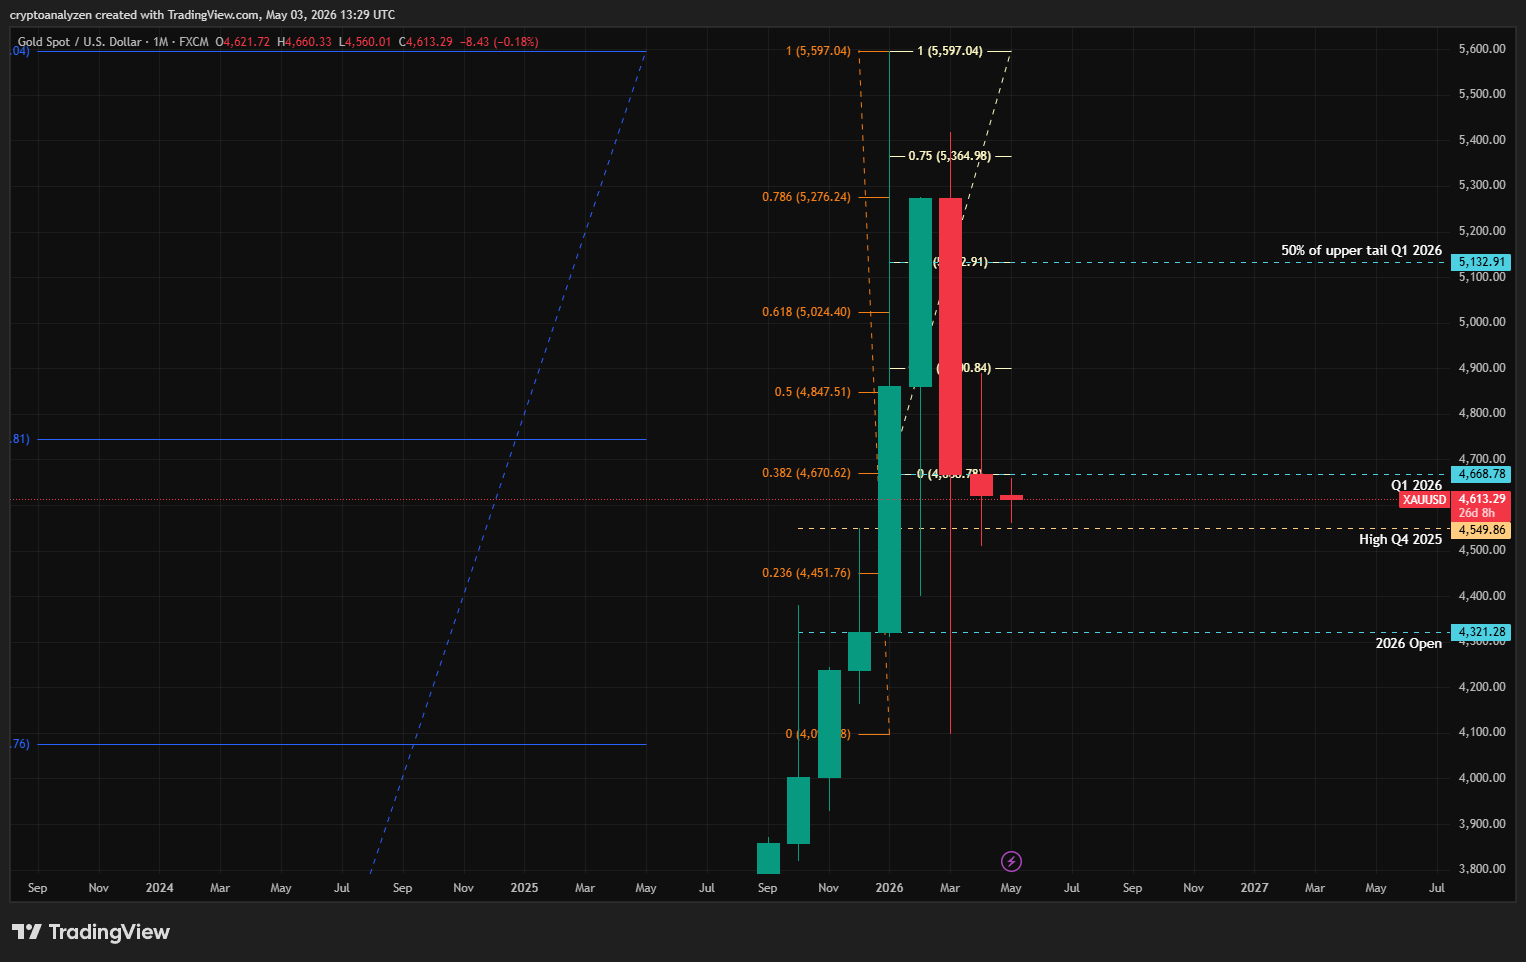
To understand where gold is going, we need to step back and start from the 3-month chart.

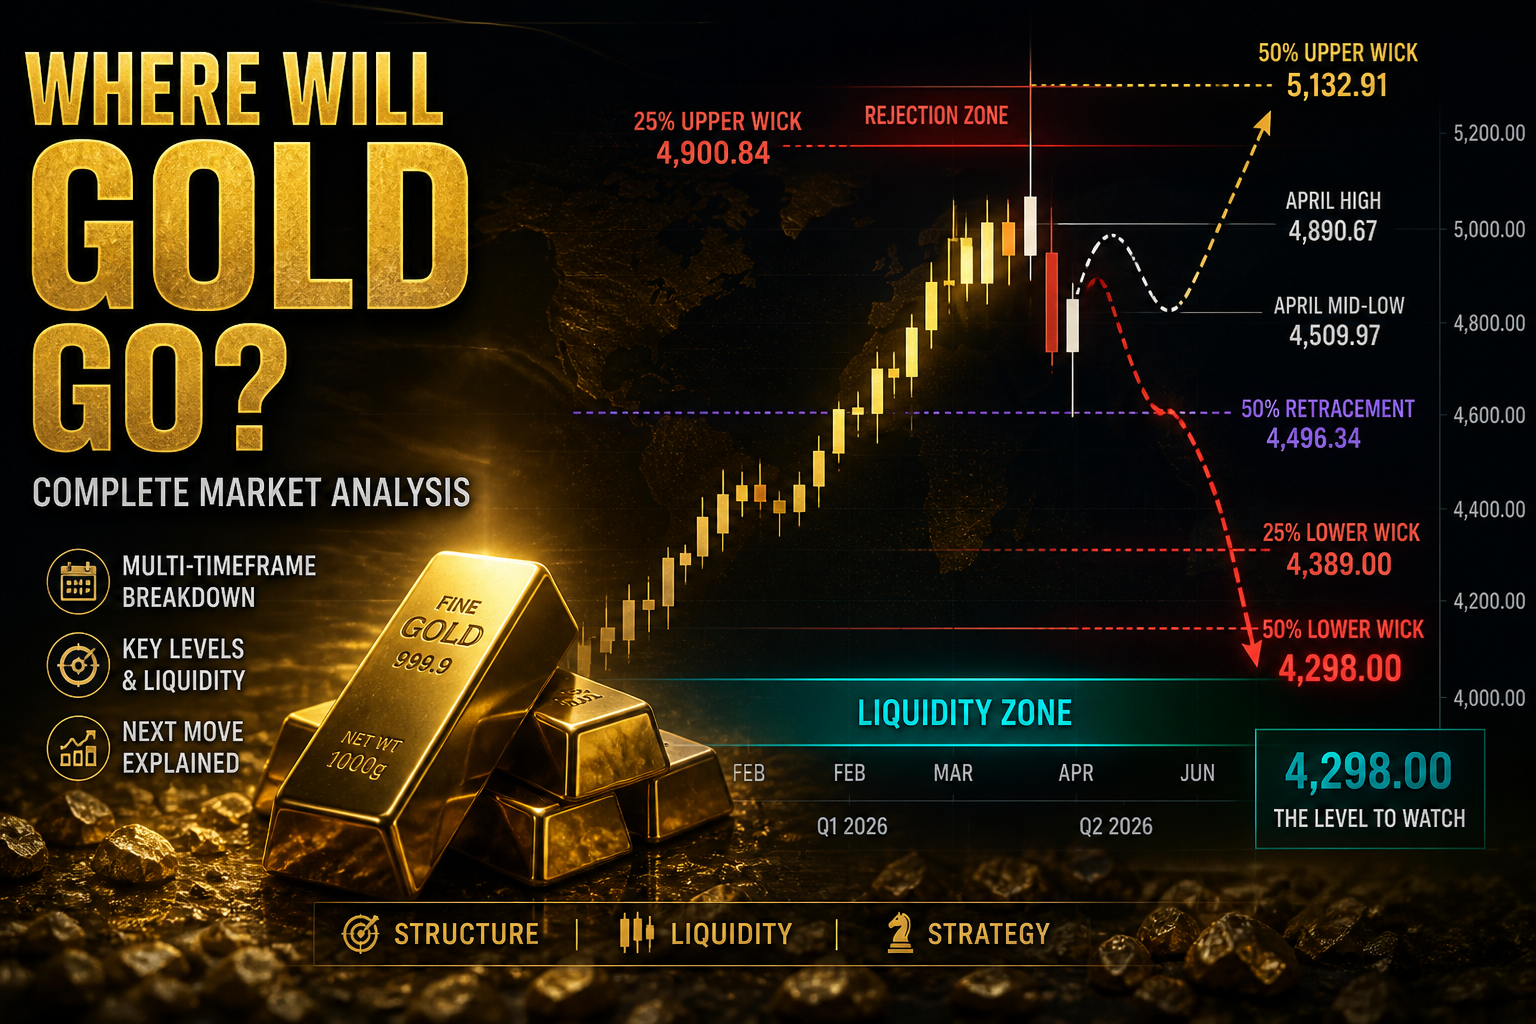
At the start of April, price moved just below the Q4 2025 high (4,549.86), establishing a mid-low at 4,509.97.
This behavior confirmed liquidity interaction below prior highs before continuation attempts.
However, the upside was capped at 4,900.84, aligning with the 25% level of the quarterly upper wick — a technical rejection zone.
The initial expectation for Q2 was a continuation toward 5,132.91 (50% of the upper wick), followed by a higher time frame rejection.
This rejection has now materialized on the monthly timeframe.
2. Monthly Compression
April closed as an inside candle. This is important — it signals compression, not direction.
This structure keeps both directional scenarios open:
- Bearish: Breakdown below 4,509.97
- Bullish: Breakout above 4,890.67
Such formations typically precede expansion phases.
3. Weekly Liquidity Dynamics
In early May, price tapped 4,496.34, marking a 50% retracement of the prior leg up.

But the more important signal lies in the long lower wick from March. It suggests that liquidity remains untested below.
Key technical levels:
- 4,389 → 25% of lower wick
- 4,298 → 50% of lower wick
- Near 4,312 → 2026 opening level
A previous attempt to reach lower liquidity failed, increasing the probability of a renewed downside move.
4. Daily Timeframe Behavior
Interestingly, while the weekly chart leans bearish, the daily chart suggests a short-term upside move.

At the end of April:
- Price entered an order block
- Strong bullish reaction followed
However, Friday’s session showed weakness:
- Price tested the weekly open
- Closed below the daily open
This suggests a potential liquidity grab before directional continuation.
5. Probable Scenario
The most coherent scenario based on current structure:
- Short-term upward movement
- Test of 4,748 (62% Fibonacci retracement)
- Rejection at resistance
- Return into the order block
- Breakdown toward 4,298
6. Strategic Interpretation
This market is not trending cleanly — it is rotating through liquidity phases:
- Phase 1: Short-term bullish retracement
- Phase 2: Mid-term bearish continuation
- Phase 3: Macro bullish expansion
7. Key Levels Summary
- Resistance: 4,748 → 4,900
- Pivot zone: ~4,500
- Target liquidity: 4,298
- Expansion target: 5,132
Final Conclusion
Gold is likely to complete a corrective upward move before entering a deeper retracement phase.
The zone around 4,298 stands out as the most probable base for the next major bullish continuation.
-----
gold price prediction, gold analysis 2026, XAUUSD forecast, liquidity trading, smart money concept, order block trading, gold technical analysis, fibonacci levels gold, trading strategy gold, market structure analysis
Subscribe to newsletter