Solana (SOL) Price Analysis: Bearish Structure Points to Further Downside
Solana (SOL) Technical Analysis
Solana is currently exhibiting signs of structural weakness as price action continues to move within a broader bearish framework.
The weekly chart suggests a continuation of the downtrend, although short-term squeeze moves to the downside may occur.
Monthly Gap Zone – A Key Area
On the monthly timeframe, SOL has entered a gap zone, which often acts as a price magnet.
This increases the probability of further downside exploration before stabilization.
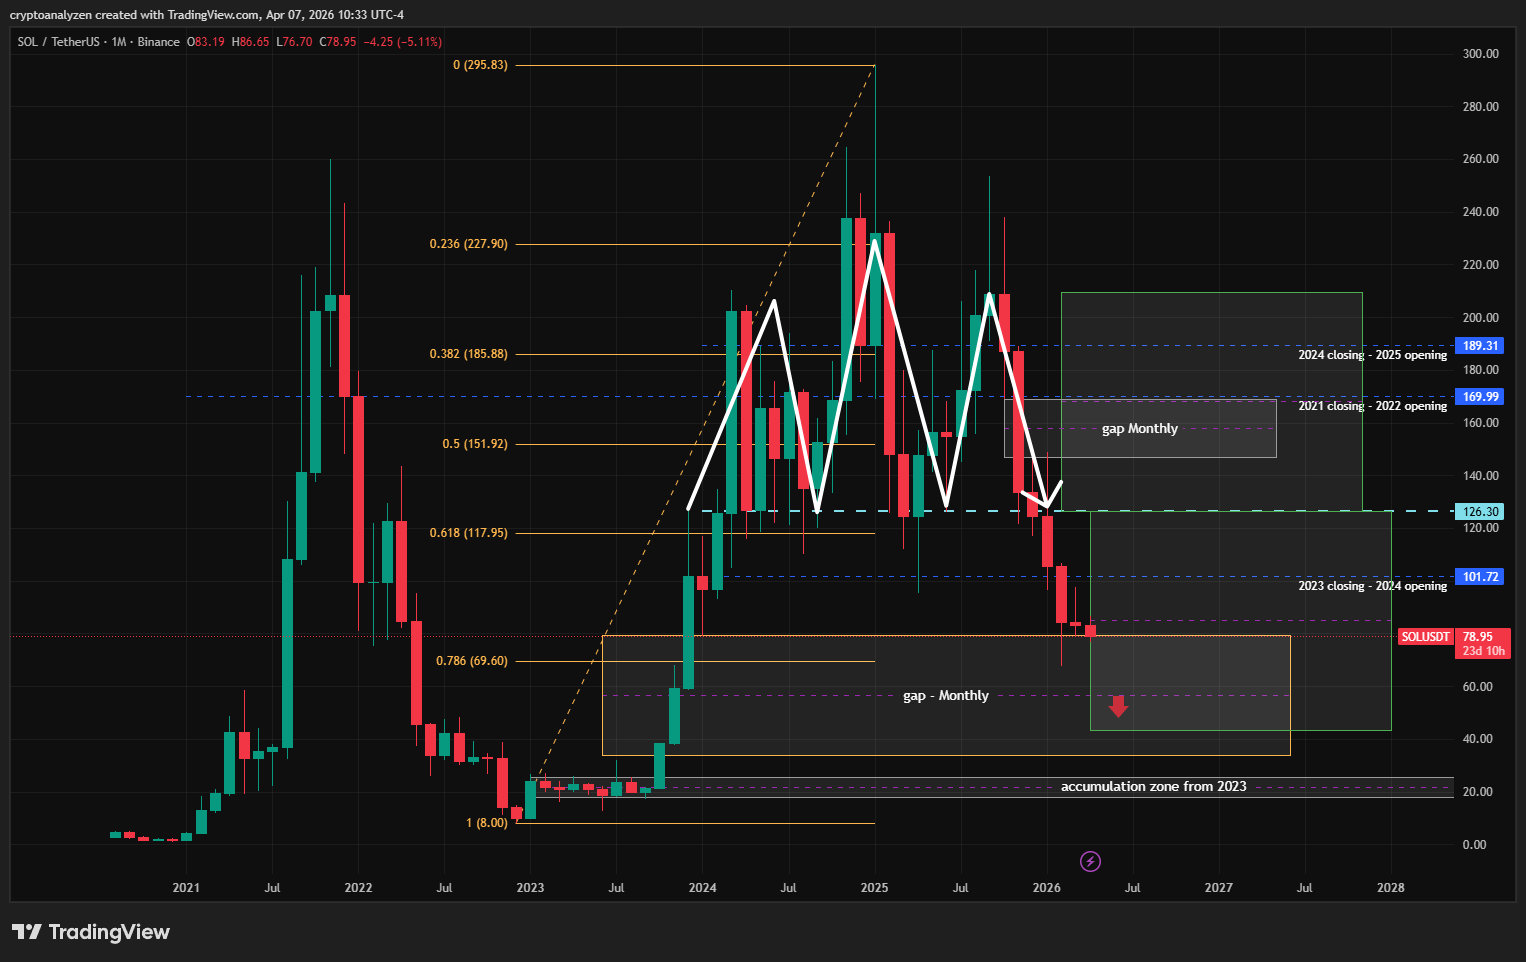
Key Levels:
- 79.29 – Upper gap boundary
- 69.60 – 71.8% Fibonacci retracement (from 8.00 to 295.83)
- 56.45 – Gap midpoint
- 33.70 – Lower gap boundary
Bearish Pattern: Head & Shoulders
A clear Head & Shoulders formation is visible on the higher timeframe, reinforcing the bearish outlook.
The projected move from the neckline indicates a potential downside target at:
➡️ 43.28
Outlook
Given the current structure:
- The market remains bearish
- Short-term rebounds are likely corrective
- Downside targets remain in play
Conclusion
Solana is currently positioned in a technically sensitive area. Unless key resistance levels are reclaimed, the probability of further downside remains elevated.
Subscribe to newsletter