XRP Price Prediction Q2 2026: Is a Drop to $0.94 Inevitable?
XRP (Ripple) — Risk of a Decline to $0.9413
With Q1 2026 now behind us, XRP’s price action provides a structured multi-timeframe setup that deserves closer attention.
Higher Timeframe Context (3M Chart)
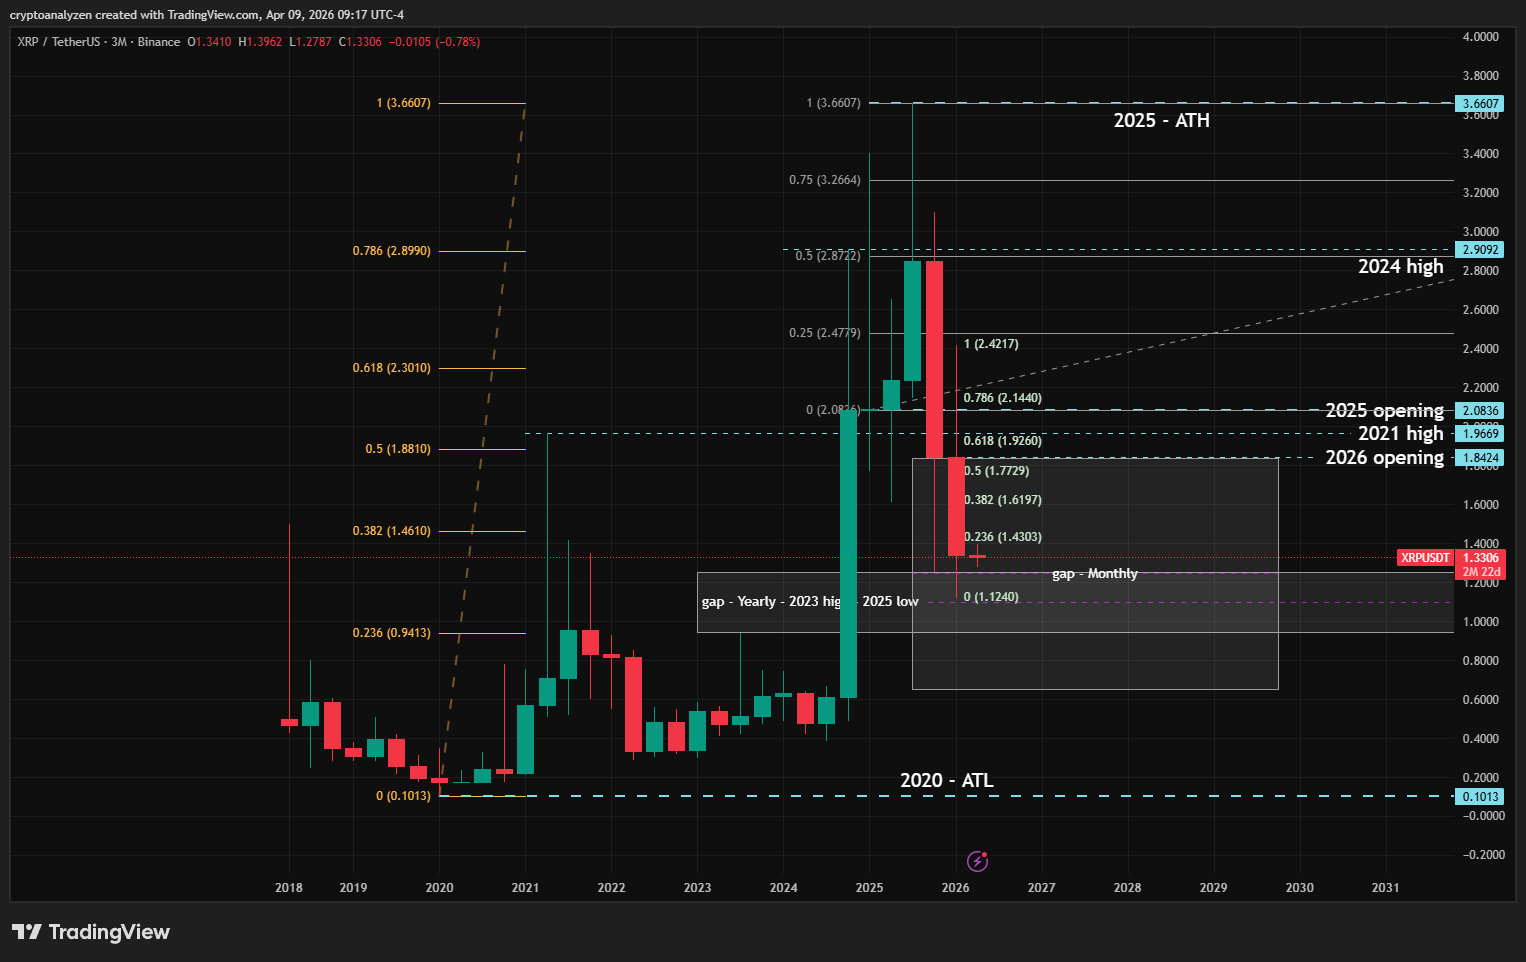
At the beginning of the year, the annual chart highlighted a key imbalance zone:
- 2023 High → 2025 Low
This zone acted as a magnet for price — and in February, the market moved directly into it.
What followed was equally important:
XRP tested the midpoint of this gap and reacted sharply.
This confirms:
- The gap is valid
- The market is not done with it
Monthly Chart Breakdown
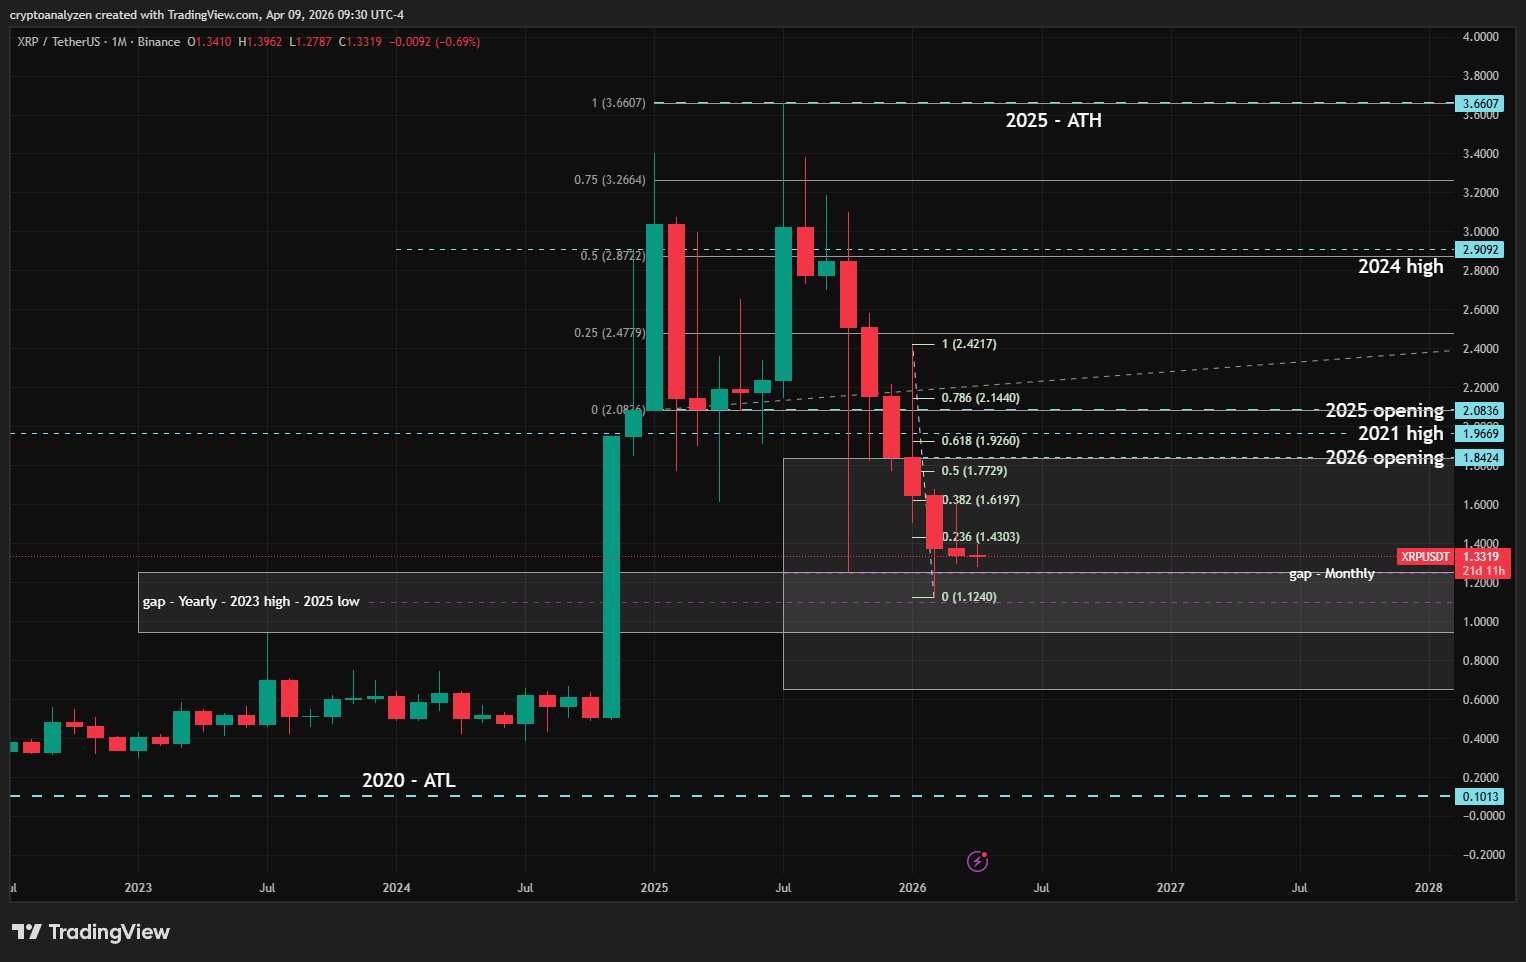
The monthly timeframe reveals a lack of true bullish continuation:
- March formed an inside candle, fully contained within February
- Price tested approximately 38% of the 2026 range
- Early April produced a new mid-low, signaling weakness
- The market tested the 23.6% Fibonacci retracement
This structure suggests consolidation — not reversal.
Current Price Position
XRP is currently trading near $1.2470, a critical confluence zone:
- Upper boundary of the annual gap = Midpoint of the monthly gap
This area acts as resistance rather than support.
Downside Scenarios
Given the broader crypto market environment, the probability favors a continuation to the downside.
Primary Targets:
- $1.1083 → Midpoint of the annual gap
- $0.9413 → Lower boundary of the annual gap
Extreme Scenario:
- $0.6465 → Lower boundary of the monthly gap
Market Logic
Markets tend to:
- Fill inefficiencies
- Revisit gaps
- Complete unfinished structures
From this perspective, the current consolidation appears to be a pause — not a reversal.
Conclusion
Despite temporary strength, XRP remains structurally vulnerable.
Unless the price decisively reclaims and holds above the gap resistance zone, the path of least resistance remains downward — with $0.9413 as a key target.
Subscribe to newsletter